Pension Matters
State Employees Retirement Fund
Most Recent Market Value | Michigan Treasury Bureau of Investments
July 2017
Social Security Increases Security
In last month’s newsletter I wrote about new security measures being put into place by Social Security in June which will require a security code for admission. I have recently clarified with SSA that this code will change every time you sign in.
Starting June 10, the Social Security Administration will require you to choose a second identification method to log into your My Social Security online account. You’ll have to provide a cell phone number or an e-mail address; a one-time security code will be sent as a text or email each time you log into your account. You’ll have to plug in the code to access your account.
Federal Reserve Report
According to the Federal Reserve’s Financial Accounts Report recently released, U.S. corporate defined benefit plan assets rose by $18.4 billion in the quarter ending March 31, reaching $3.362 trillion, a 0.55% increase, U.S. corporate defined contribution plans increased by $227.3 billion during the quarter, or 3.9%, to $5.982 trillion. The report, formerly known as the Flow of Funds Accounts , indicates state and local government defined benefit plan assets added $66.3 billion in the quarter ending March 31, a 1.2% increase to $5.676 trillion from $5.609 trillion three months earlier.
Good News
According to an article in Pensions and Investments, state and local government defined contribution plan assets totaled $514.8 billion as of March 31, up 4.3% from $493.4 billion as of Dec. 31. State and local government DB plans’ funded status rose in the fourth quarter to $3.96 trillion, up from $3.83 trillion in the previous quarter. Read more at www.pionline.com.
Census Shows Population Up and Older
Michigan’s population is growing, but it is also graying, according to population estimates released recently by the U.S. Census Bureau.
As of July 2016, when the Census collected the data, Michigan had 9.93 million people, up from 9.88 million counted in the 2010 Census. That made Michigan the 10th most populous state.
But it also is two years older than the nation as a whole, according to an analysis by the state demographer. The national median age is 37.9, but for Michigan, that is 39.7. See the full report.
Should Social Security Invest in Equities?
Policymakers have long known that the retirement of the baby boom generation would produce significant deficits for the Social Security program. Restoring balance will require raising taxes, reducing benefits, or both. Some argue that shifting a portion of the Social Security trust fund from bonds to stocks, as part of a reform package, could reduce the size of the required tax increases or benefit cuts. A new report out from The Center for Retirement Services discusses this issue in a new briefing. You can read the full report at http://crr.bc.edu.
Survey of Public Pensions
State and local government defined benefit plan contributions totaled $191.6 billion in 2016, up 6.6% from the previous year, according to the U.S. Census Bureau’s 2016 annual public pensions survey. Contributions by governments accounted for the majority of contributions, totaling $140.6 billion in 2016, up 6.5% from the previous year’s total of $132 billion. According to the report, state governments contributed $60.6 billion. Representatives at 299 state pension plans and 5,977 local defined benefit plans participated in the survey. Read more data at www.census.gov.
COLA Increase Probable, But Don’t Count on Much
Although the final numbers won’t be known until October, current inflation trend points to a Cost of Living Adjustment (COLA) of about 2% for next year. But don’t count on seeing the whole amount of the increase because rising healthcare costs and Medicare premium increases are likely to cut into any additional benefit you may receive. This Reuters article explains how any COLA increase will be offset by higher Medicare premiums, and also discusses the general trend of Social Security recipients losing buying power, largely due to healthcare costs. Find the article at: www.reuters.com.
Connections Report from Office of Retirement Services (ORS)
The June 2017 report shows the FY 15-16 Financial summary for the State Employees Retirement System. Highlights of the report are:
- Nearly 70 percent of the system’s funding comes from investment earnings
- Net assets were $12.6 billion at the close of FY 2016
- Funded ratio is listed as 64.53 percent for FY 2016
“The State Employee’ Retirement System is on schedule to be fully funded in 20 years. This puts the system at the forefront nationwide for funding best practices.”, according to this report.
DB Plans Nationwide
As of March 31, 2017, US total retirement entitlements added up to $30.3 trillion, including $26.1 trillion of retirement assets and another $4.2 trillion of unfunded liabilities. Including both retirement assets and unfunded liabilities, retirement entitlements accounted for 39 percent of the financial assets of all US households at the end of March.
Unfunded liabilities are a larger issue for government DB plans than for private-sector DB plans. As of the end of the first quarter of 2017, unfunded liabilities were 13 percent of private-sector DB plan entitlements, 32 percent of state and local government DB plan entitlements, and 54 percent of federal DB plan entitlements.
US Total Retirement Entitlements
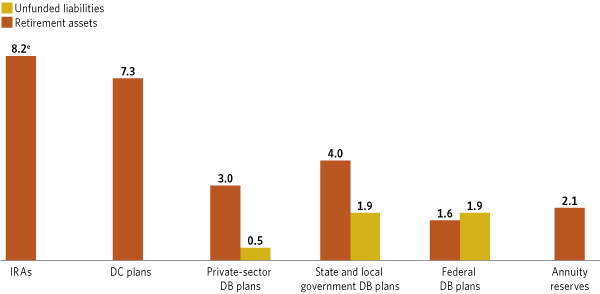
Trillions of dollars, end-of-period, 2017:Q1
© Data are estimated.
Note: Components may not add to the total because of rounding.
Source: Investment Company Institute
The quarterly retirement data tables are available at “The US Retirement Market, First Quarter 2017.”
Investment Advisory Committee Meeting
The following information is taken from the June 8, 2017 State of Michigan Retirement Systems Quarterly Investment Review which you can find on line at the Michigan Department of Treasury website.
Over the past three, five, seven, and ten years, the returns are much higher than peer median returns. When compared to the State Street Universe of public pension plans greater than $10 billion, the returns are among the highest. Perhaps as notable, over the past three and five years, the returns were the least risky, as measured by standard deviation of returns.
- The ten-year return includes the impact of the global financial crisis. Over a very long horizon, since 1979, the annualized rate of return on the plan assets have been approximately 9.3%.
- Compounding even slightly higher than peer returns on $64.2 billion of SMRS assets, significantly adds up over time. For example, the ten-year annualized return of 6.1% compared to the 5.5% peer median return adds roughly $6.4 billion of value to SMRS over a ten-year period.
- The returns fell below the policy benchmark over the past year by -0.4%. Many of the asset classes posted results in excess of their performance benchmark, however small allocation differences tipped the performance below the policy benchmark.
- For the year ending March 2017, returns matched the peer median return. Differences in asset allocation compared to peers seemed to even out over this time period. Most asset class returns matched or exceeded peer returns.
Editor’s note: June Morse may be contacted at jmorse10@comcast.net or 517-886-9323.
Return to top of page